Charts
“Charts” is a new feature of RG3. It displays aggregated data for “Fullpress Reports”, “Printed Reports” and “Webnative Reports” in form of various diagrams. Below you will find full list of currently available charts with some explanations:
Fullpress Charts
AFP Data Written
This chart shows how much data (in KB/MG/GB) was written to Webnative through AFP connection

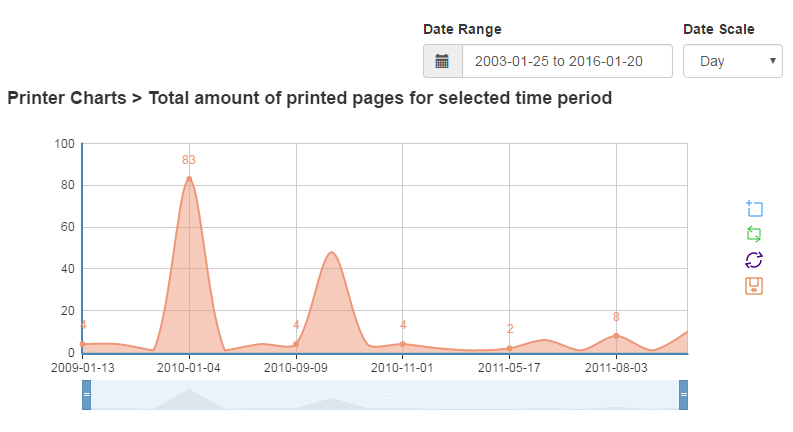
- Date filter allows you to select a period for which you want to see the results
- Date Scale allows you to set whether you want data to be grouped by days, months or years
- Chart configuration buttons allow you zoom in, zoom out, reset chart to default state or download it as an image.
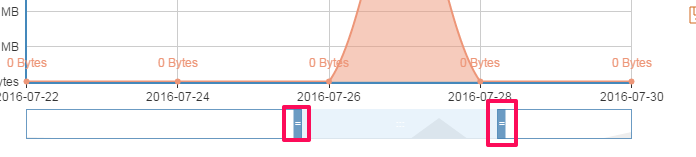
NOTE: you can also zoom in by dragging your cursor over chart’s surface. To down
NOTE: in order to download the chart click “Save” button and then click on a popped up chart. The download will start immediately
4. Quick periodic filter. You can quickly select required data period by dragging left and right margin buttons:
Logins/Logouts
This bar chart shows amount of AFP logins & logouts for selected time period:

- You can click on legend labels to toggle them on and off
Printer Charts
Print Bandwidth
Pie diagram that shows amount of data (in KB/MG/GB) was printed through Webnative server.

Total Printed
Shows total amount of pages printed for selected time period through Webnative server

Webnative Charts
Period
Shows total amount of Downloads/Activity for selected period of time and given Webnative server. Downloads include custom, hires, fpo and preview. Activity includes upload, copy, move, delete, makeDir.
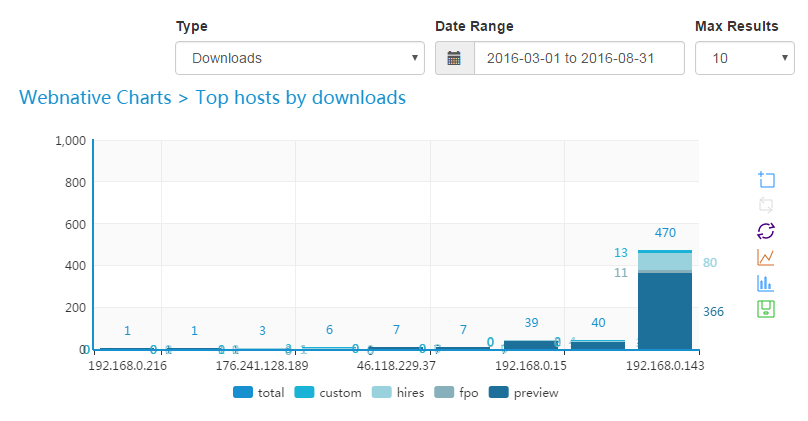
- Type dropdown allows you to view Downloads or Activity chars.
- You can click on legend labels to toggle them on and off
Top Files
This bar chart shows files with most downloads for selected period of time
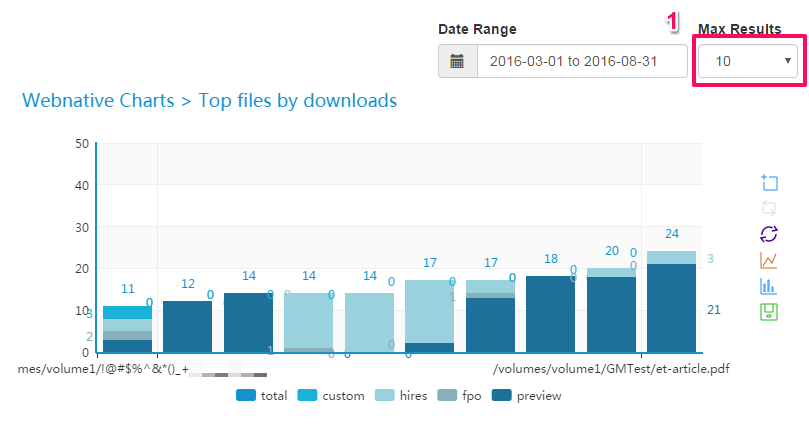
- Mar Results dropdown allows you to set how many files with most downloads you want to view.
Top Groups
This bar chart shows groups, users from which had most downloads or file activity.

- These buttons allow you to toggle chart view between line and bar.
NOTE: only users’ “Primary Groups” are taken into account in this chart.
Top Hosts
This bar chart shows hosts with most downloads/activity for selected period of time

Top Users
This bar chart shows users with most downloads/activity for selected period of time
Volume Bandwidth
This pie chart shows total downloads (custom, hires, fpo, preview) per volume and selected period of time
